OnlineClassroom
The goal of this passive physical data visualization is to give teachers a better way to interact with their online classrooms. In collaboration with VisualClassrooms, I built this unit to, with a glance, give teachers an insight into the behaivior of their classroom.
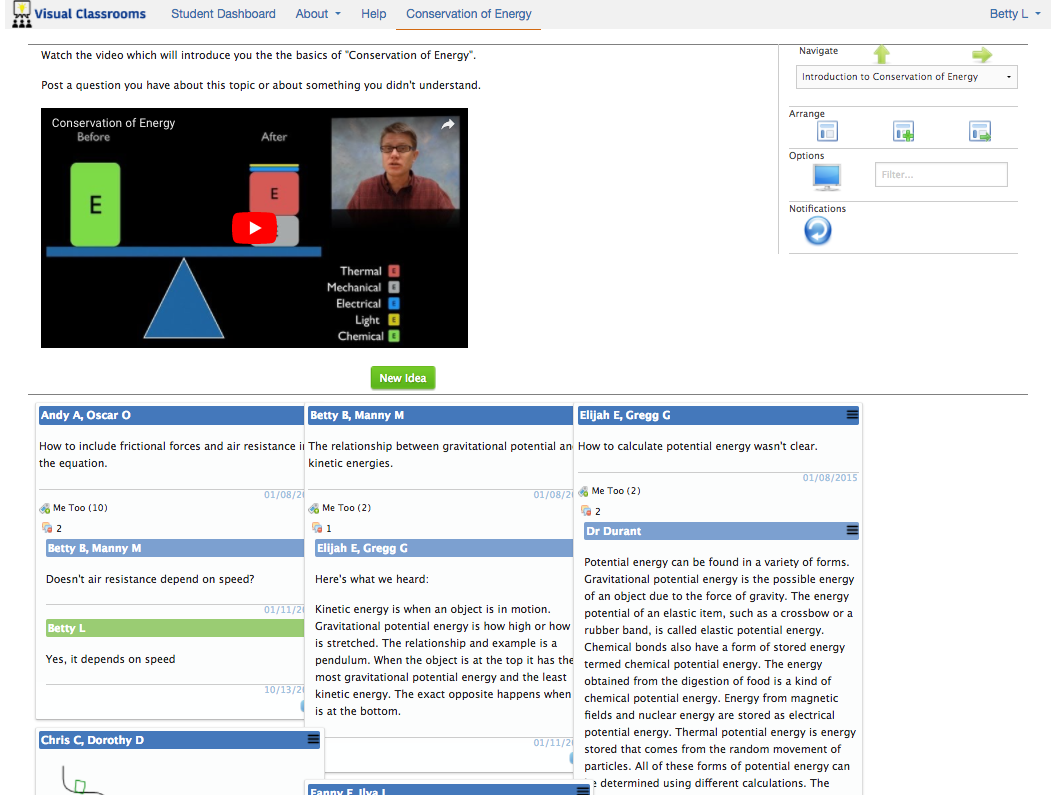
VisualClassrooms is an online discussion forum that is designed for online classrooms. Through its interface of sticky-note like posts, it helps teachers and students discuss, collaborate, and learn from eachother. From chatting with teachers who used this tool, I learned a common complaint. Unlike in a physical classroom, it was hard for a teacher to get a quick gauge of the class. Often teachers would log in to the service only to find no changes. Other times, these teachers would spend time away from the tool, and come back to a handful of posts that could have benefited from a quicker response.
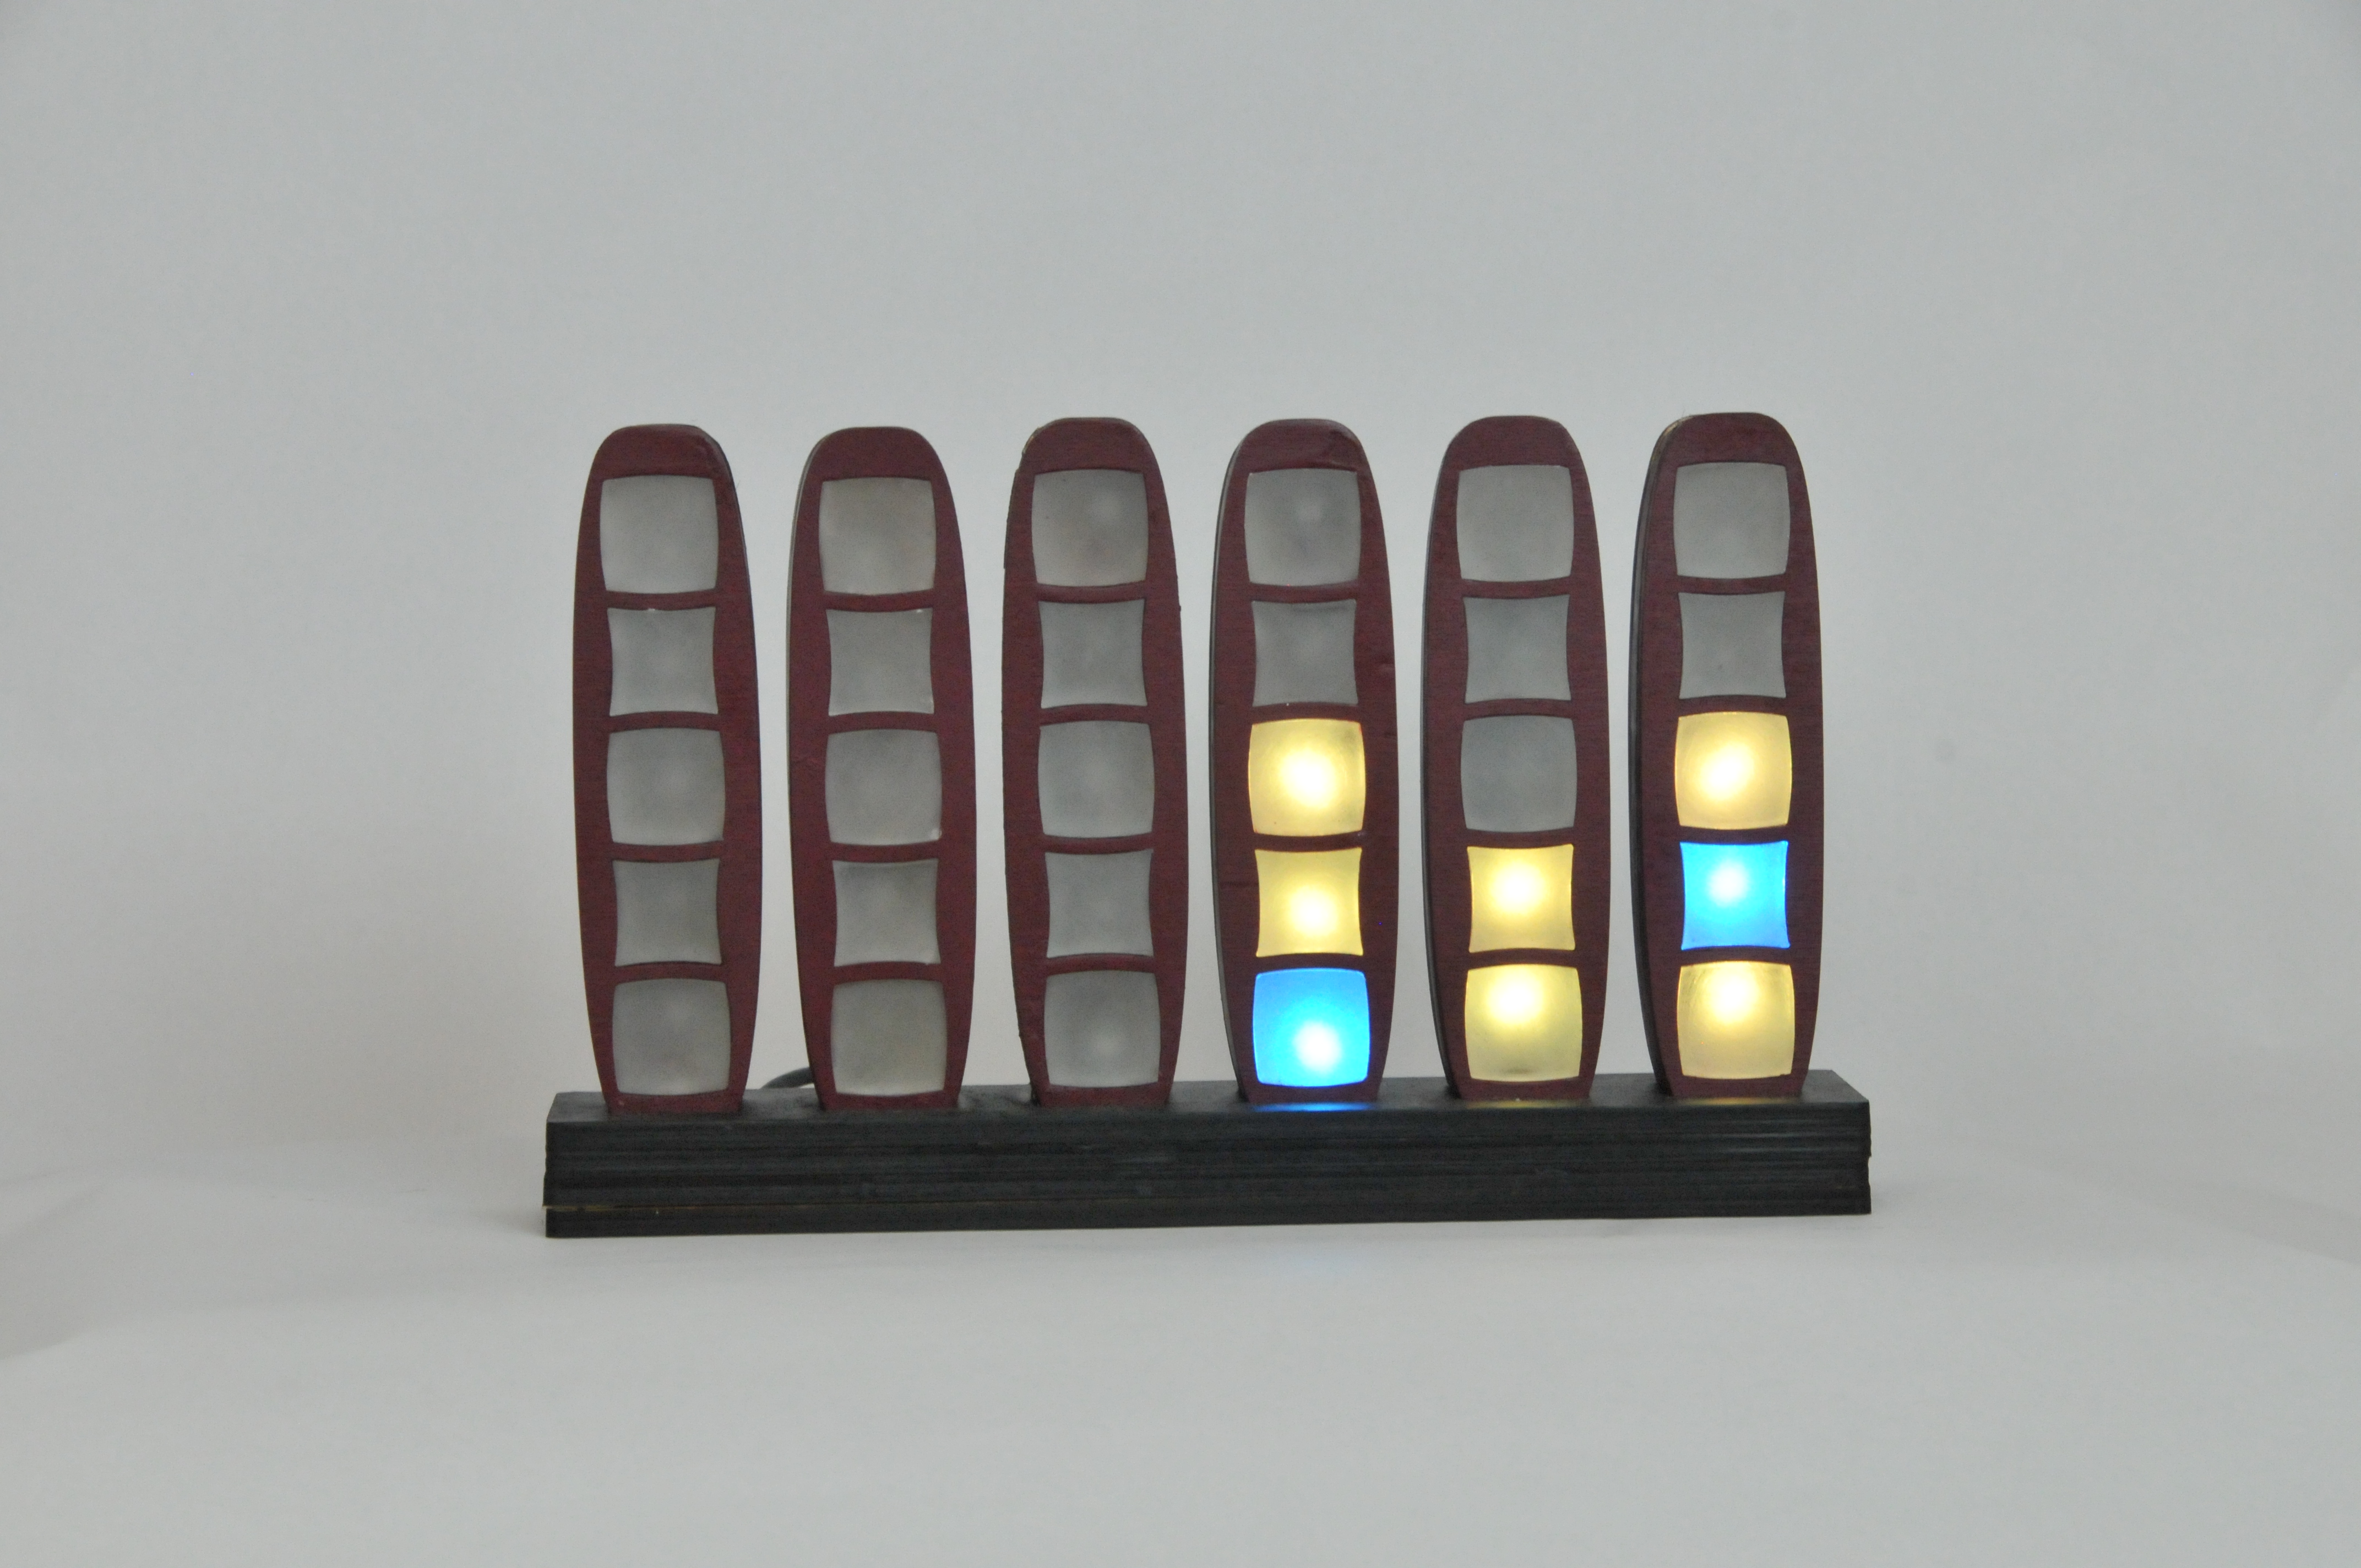
I wanted to build a tool to help solve these issues by making it easy to check up on the class. This unit sits in a teachers office or classroom, and has a lit interface that constantly matches the status of the online classroom. Each window denotes the presense or absense of a recent post, with the color changing in relation to the poster’s role (teacher, student, TA, etc). Each column denotes a conversation thread. Related posts will stack on top of eachother. The lit interface itself is updated everytime a new post occurs.
With a quick glance, a teacher can begin answer the key question: should I login to the online classroom to interact with my students? The tool casually displays information about new posts and new threads. It doesn’t bother the teacher with pings or buzzes. Instead, it sits there waiting, only engaging with the teacher when he or she thinks of the class and glances over.
Header photo © teaching.temple.edu
Body Photos © Sam Woolf 2017, © visualClassrooms.com
Icon photo © Sam Woolf 2017